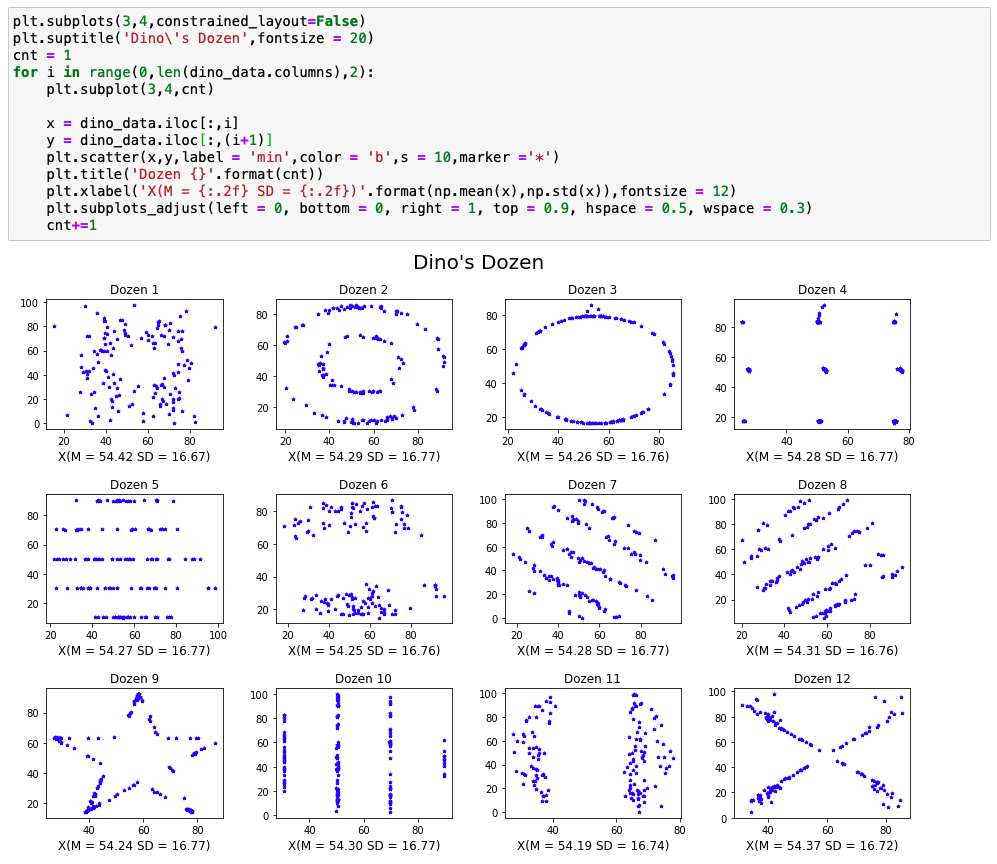
이번에는 산점도 행렬을 만들어 볼 것이다
그림에는 나와 있지 않지만 가로 세로에 각 데이터의 x축의 평균과 표준편차 y축의 평균과 표준편차를 넣어줄 것이다
[ Import 라이브러리 ]
import numpy as np
import pandas as pd

import matplotlib.pyplot as plt
import seaborn as sns
plt.rcParams['figure.figsize'] = [12, 8] # figure size 고정
[ 데이터 가공 ]
dino_data = pd.read_csv('dino12.csv',index_col = 0)

dino_data.drop('dino_X',axis = 1,inplace = True)
dino_data.drop('dino_Y',axis = 1,inplace = True)
이전에 이미 dino 데이터로

그래프를 그려주었기 때문에 drop을 통해서 없애준다
axis = 1 은 column을 의미하고
반대로 axis = 0 이면 row 삭제를 의미
inplace = True이면 원래 dino_data에 drop 한 데이터를 넣어준다는 것이다
반대로 False를 사용한 후 dino_data를 불러오면 dino_data가 원래 데이터와 동일한 것을 알 수 있다.
plt.subplots(3,4,constrained_layout=False)
plt.suptitle('Dino\'s Dozen',fontsize = 20)
cnt = 1
for i in range(0,len(dino_data.columns),2):
    plt.subplot(3,4,cnt)

    x = dino_data.iloc[:,i]
    y = dino_data.iloc[:,(i+1)]
    plt.scatter(x,y,label = 'min',color = 'b',s = 10,marker ='*')
    plt.title('Dozen {}'.format(cnt))
    plt.xlabel('X(M = {:.2f} SD = {:.2f})'.format(np.mean(x),np.std(x)),fontsize = 12)
    plt.subplots_adjust(left = 0, bottom = 0, right = 1, top = 0.9, hspace = 0.5, wspace = 0.3)
    cnt+=1
plt.rcParams['figure.constrained_layout.use'] = True
plt.subplots(3,4,constrained_layout=False)
- subplot의 기본 모양을 보여주는 것이다
- plt.subplot(rows, columns)
- constrained_layout = False로 설정해주는 이유는 그래프의 간격을 조절해주기 위해서 subplots_adjust 나 tight_layout을 사용할 것이기 때문에 True로 되어있으면 아래와 같은 오류가 뜨게 된다
<ipython-input-6-7946e7238530>:12: UserWarning: This figure was using constrained_layout==True, but that is incompatible with subplots_adjust and or tight_layout: setting constrained_layout==False. plt.subplots_adjust(left = 0, bottom = 0, right = 1, top = 0.9, hspace = 0.5, wspace = 0.3)

plt.suptitle - 12개의 그래프를 대표하는 데이터 제목을 정할 수 있다
나머지 부분은 [ 이전 게시물 ]과 거의 같고
- title 부분에서 숫자 하나씩 높여주면서 설정해주고
- plot 대신에 scatter을 사용
- 가장 다른 점 plt.subplots_adjust(left = 0, bottom = 0, right = 1, top = 0.9, hspace = 0.5, wspace = 0.3)


보이는 것처럼 plt.subplots_adjust을 사용하면 그래프 간의 간격을 조절할 수 있는 것을 알 수 있다.
plt.subplots_adjust을 설정할 때 주의할 점은 left <= right & bottom <= top 이것을 지키지 않으면 아래와 같은 오류가 뜰 수 있다.

그리고 이 글을 쓰면서 코드를 만지작 만지작 해 본 결과
plt.rcParams ['figure.constrained_layout.use'] = True는 딱히 필요하지 않다
원래는 그래프에 소제목이 다른 그래프에 겹쳐지거나 suptitle이 그래프에 겹치는 경우 때문에 여러 방법을 찾아본 것이었는데 없어도


없어도 아래와 같이 멀쩡하게 잘 나오는 것을 알 수 있다

'CODING > Python' 카테고리의 다른 글
| [Python/Flask] flask-restx를 이용한 CRUD구현 (1) : 가상환경 설치하기 (0) | 2021.11.23 |
|---|---|
| [Python] - 딕셔너리 key, value 서로 위치 바꾸는 법 (0) | 2021.11.05 |
| [Python/Django] Mac 장고 venv로 가상환경 생성 (0) | 2021.08.08 |
| [데이터/Python] # 3 비표준화계수란 (2) | 2020.08.08 |
| [데이터/Python] # 1 데이터 저널리즘이란 (0) | 2020.07.31 |


댓글